- May 14, 2025
- 6 min read
Updated: Nov 17, 2025
Disclaimer: For educational purposes only, see full disclaimer.
In this post, I’m going to show you how to find upside stocks with 3 powerful screening methods. To be EXACT, find exciting stocks outperforming the Magnificent Seven stocks.
The 3 screening methods use technical analysis. They screen for upside stocks suitable for trend following and momentum. The last method is so simple that I call it the Lazy Method (more on that later).
So if you want to find "under the radar" stocks before everyone else, then you'll love this in-depth stock screening tutorial.
Let’s dive right in…
What is Stock Screening & Why Use One?
Stock screening is a method of selecting stocks based on rules. This can help you broaden the pool of stock ideas and filter out noise. In other words, stock screening helps you separate the winners from the losers.
A shortcut to success
Investing is hard work, which takes practice and discipline.
To quote the Sage of Omaha (Warren Buffett):
If you like spending six to eight hours per week working on investments, do it. If you don't, then dollar-cost average into index funds.
If you are reading this post, then you have already decided on the DIY route when it comes to managing your money.
A set of screening rules will make life easier and save you time in picking stocks.
Pro Tip: You are also replicating investment gurus' success when you copy their methods. BUT, make sure their style is compatible with your own personality.
Stop Getting Emotional
As the saying goes: "You are your Own Worst Enemy".
The holy grail of trading is to avoid these emotional biases to make better decisions. After all, you want a good night's sleep and not to worry about impulse buying or panic selling.
What are the Golden Rules for Upside Stocks?
The short answer?
Yep, you guessed it... It depends.
One man's trash is another man's gold.
Common stock screeners focus on fundamental or value investing factors. Examples include price-earnings (PE) ratio, dividend yield, and highest revenue growth. They often yield unexciting price charts that are trending downward or flat.
Here are some stock screening examples using technical analysis. We will show you how to look for upside stocks with trend following or momentum potential.
Our mission is to demystify this field so that more beginners can profit from these methods. Besides, it may open up a new world of possibilities. Rather than the same old tired advice looking for stocks with the lowest PE ratio.
Method 1: Upside Stocks for Trend Following
Let's start with a method derived from the wisdom of John Murphy. He is the author of many technical analysis books, including The Visual Investor: How to spot Market Trends.
A real-world implementation is StockChart's Technical Ranking or SCTR (pronounced as scooter). The SCTR ranking is calculated as a 0-100 score like this:
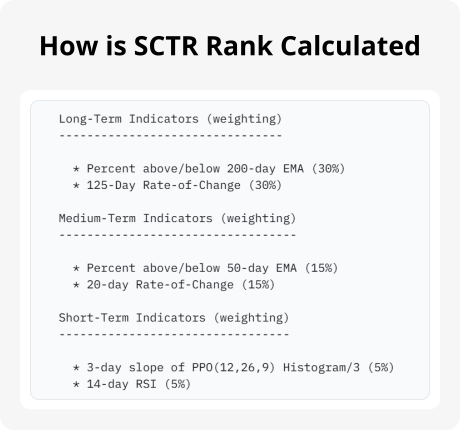
The rule logic places more weight (60%) on long-term indicators. Less weight (30%) on medium-term indicators, and least weight (10%) on short-term indicators.
From this technical analysis view, bullish stocks mean:
Days Above: Stock price is usually above the moving average (EMA) line in the past 10 months (200-day) and in the past 2.5 months (50-day).
Price Change: Stock price % change is higher the better (Rate-of-Change) in the past 6 months (125-day) and in past 1 month (20-day).
Pro Tip: There are about 20-22 trading days in a month. Divide the look-back period (i.e. 125-day, 20-day) by 20 to get the period in month.
Trend followers believe in "the trend is your friend" and follow it until the end when it bends. They are the complete opposite of bottom-fishing fundamental value investor.
StockCharts provides its SCTR list for free. You can start adopting this method right away.
Method 2: Upside Stocks for Momentum
When I first started learning technical analysis, I struggled to understand momentum. Isn't it same as the rate-of-change (or % change)?
The difference?
How fast and pure does it get there.
The second screening method is from Andreas Clenow's book Stocks on the Move: Beating the Market with Hedge Fund Momentum Strategies.
If you remember 7th grade algebra, you will remember Rise over Run (or Slope), like this:

You got to be joking... This is how we beat hedge funds?
Let me explain.
When you put stock prices as dots on an XY chart, you can draw a straight line where it best fits the dots, like this:

The straight line is the trend line for the stock prices. Upward sloping means a bullish trend. Downward sloping means a bearish trend.
This is the linear regression method. Now we are entering college level math territory...
Wait a minute.
Stock prices don't grow in a straight line... Like money don't grow on trees...
What about market volatility and compounding growth? You may protest...
You are right. If we want to take volatility and market dynamics into account. We will use the exponential regression instead. This will help us measure the "slope" or momentum to better compare stocks. See the difference below:

Pro Tip: The linear slope is in dollars and cents, while the exponential slope is in percent. The exponential slope is a better metric for comparing stock prices. Especially, when one stock's price is at $100 and another is at $5. The same $2 price move is night and day for $100 (+2%) and $5 (+40%).
Here is the full screening method by Andreas Clenow:
Slope: Annualized 90-day exponential regression, multiplied by the coefficient of determination (R-squared).
Filter 1: Only consider stocks above the 100-day moving average.
Filter 2: Disqualify any stock that has a move larger than 15% in the past 90-days.
R-square: Measures how close the stock prices are to the regression line. In other words, the closer the better (higher score). We are adjusting the slope by penalizing volatility. Less volatile stocks get a better score.
This momentum method is screening for stocks with the best trajectory in the last 3 months. Meanwhile, excluding stocks not bullish enough (Filter 1) and has sudden jumps (Filter 2).
Clenow's stock screening method for momentum (also a trend follow method) may not be rocket science. Yet, the bells and whistles make a lot of common sense.
Method 3: Upside Stocks the Lazy Method
Our Lazy Method is the simplest way to understand the technical analysis view for any stock. We designed it to help you make better investment decisions.
How simple?
We use a simple decision making method popularized by Benjamin Franklin...
The Pros and Cons List.
We divide the page into two columns. Under the Pros column, we list all the bullish technical patterns and indicators. Under the Cons column, we list all the bearish factors.
We currently scan for >100 signals:
82 candlestick patterns and 23 chart patterns.
Here is our bullish vs. bearish decision matrix for all current signals. We call it the Scorecard:

We count the number of bullish vs. bearish signals. For example, 3 bullish signals and 2 bearish signals is 4 : 2.
We then find the net count for today, which is +2.
4 bullish - 2 bearish = +1 net count.
Positive (+) net count is classified as bull, while negative (-) net count is classified as bear.

We compare today's net count with all net counts in the past 1 year. This allows us to determine how strong or weak for the stock currently studying.
Using this method, we can determine how bullish or bearish for today. We can further classify today as strong, normal, or lazy according to quartile (every 25%).
To recap, the Lazy Method is:
Step 1 | Count Bull Bear. Count the number of bullish vs bearish signals.
Step 2 | Count Net. Find net count (bullish minus bearish).
Step 3 | Strength Score. Find out today's strength as a 0-100 score (compare with last 1 year scale). Determine as strong, normal or lazy.
Finally, rank against other stocks using the Strength Score.
Feeling lazy? We made it easy and automated this process for you.
We provide free daily stock rankings with the Lazy Method for the last 5 trade days.
Try the demo on our homepage to see the Scorecard, LazyCharts and Charting Copilot in action.

Recapping the 3 Methods for Upside Stocks
We have showcased 3 different methods to screen upside stocks using technical analysis. We put the 3 methods together for you to see what is possible and how others have approached this.
Each method is a way of looking at the stock chart to spot profitable patterns. Technical analysis and chart reading often go hand-in-hand.
We have gone a step further to express these 3 chart reading methods as quant formulas to screen stocks. The shortcut to success is consistent decision making, free from emotional bias.
We have also referred you where to find these screening lists online, so you can use them right away. Study the charts, fundamentals, and news to see if they fit with your goals. Then add the ones you like to your watchlist to track them.
By using these stock screening methods, you are also copying the investment logic of others. Remember to choose a method that fits with your investment style.
Let us know which one is your favorite by writing in the comments section below. Or tells other better methods we have missed.