top of page
Price Action Patterns
Find actionable technical indicators and patterns with ease. Use our powerful scanner to boost your price action trading. Plan your trades with success rates (Win%), target (avg. gain/loss), and stop-loss as reference points. Become a better trader today with trading pattern performance data.
Contents

1. Chart Patterns

2. Candlestick Patterns
anchorCandleS
Chart Patterns
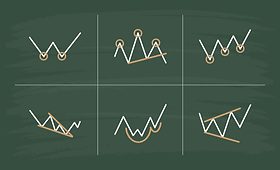

anchorChartP
bottom of page