top of page

富贵图中求,牛熊有搞头


技术形态助你在投资上运筹帷幄。培养操盘自信心。
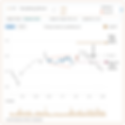
k线导航

胜率

基于证据而相信那个技术形态

  • 有根据的猜测: 凡事没有绝对,但客观精准的数据带来更美好的机遇。

  • 选秀大会比眼光: 比较技术形态的胜率,选出你的胜利人生。

  • 和盘托出: 从此不需要再背诵K线及图表形态。在需要的时候,把数据呈献在银盘上给你。


Anchor2
目标 (仅供参考)

以回测导航,放长线钓大鱼

  • 量化形态潜力: 基于实际历史数据的回测结果,不背诵、不操练、不靠估。

  • 决定进场点: 立即行动或等待更长时间。按风险报酬率,决定是否值得操作。

  • 订立交易计划: 设定符合现实的价格警报和退场目标。

  • 管理情绪: 避免因感情用事而引起的下意识反应。


Anchor3
停损 (仅供参考)

透过停损点限制下行空间

  • 限制下行空间: 世界著名市场技术分析大师发明的主流停损方法。

  • 简化复杂的方程式: 使用平均真实波幅 (ATR) 计算,因此您无需查找或学习编码即可使用。

  • 任务控管: 在图表上呈现止损线以监控形态进展,必要时采取果断行动。

  • 后备方案: 进入交易前制定计划。 设定止损点,以防交易脱轨有备无患。

  • 考虑证据的决定: 按各标的不同的波动性而量身定制定的停损点,而不是 5-10% 的划一硬性止损规则。


时间尺

透过「时间尺」培养耐性

  • 进度可视化: 看着技术形态在价格走势图发展,必要时采取果断行动。

  • 为你记住: 不同的技术形态有不同的持有期间,省去你背诵的烦恼。

  • 时间止损: 如果价格横行太久而没有达到目标点或停损点,则宜退出交易。


Anchor4
确认信号

区间突破是技术分析的北斗星

  • 确认上升或下降趋势: 减少识别K线和图表形态时的猜测。

  • 清楚标示: 向上或向下突破用不同颜色的K线标记,以帮助您练习识别它们。

  • 提高胜率: 透过区间突破确认,尤其是对于图表形态而言,实现更高的胜率。

  • 避免陷阱: 避免操之过急而鲁莽堕入「伪信号」。


跟踪形态

使用跟踪模式调查事发现场

  • 遵循图表上的形态进行调查,使用跟踪模式看宏观大局。

  • 追踪形态出现及之后的价格走势。


Trace Patterns

Investigate the crime scene with trace mode

Zoom out for a macro view and follow the trail. Trace mode lets you track when a pattern formed and what unfolded after—so you can analyze setups like a forensic pro and learn from every move.


Curious trading coach investigates past signals to improve chart reading skills.

Anchor5
Anchor6
Anchor7

Become a winning trader with these other tools 

Man laying on beach trading with ease with trading signals from laptop.

PastRef

Reel in the big fish with PastRef point.

See PastRef →

Man laying on beach trading with ease with trading signals from laptop.

Stop Loss

Limit downside with stop loss point.

See stop loss →

Man laying on beach trading with ease with trading signals from laptop.

Time Ruler

Develop patience with time ruler.

See time ruler →

Advice from the masters

乔治索罗斯 (George Soros): 重要的不是对错,而是当你正确时你赚了多少钱,当你错误时你损失了多少。

马克米勒维尼 (Mark Minervini): 第一跌的小亏损退场是你最好的损失。

查理·蒙格(Charlie Munger): 赚大钱的不是买卖……而是等待。

Trading is risky and many will lose money in connection with trading activities. All content on this site is not intended to, and should not be, construed as financial advice. Decisions to buy, sell, hold or trade in securities, commodities and other markets involve risk and are best made based on the advice of qualified financial professionals. Past performance does not guarantee future results.

Hypothetical or Simulated performance results have certain limitations. Unlike an actual performance record, simulated results do not represent actual trading. Also, since the trades have not been executed, the results may have under-or-over compensated for the impact, if any, of certain market factors, including, but not limited to, lack of liquidity. Simulated trading programs in general are designed with the benefit of hindsight, and are based on historical information. No representation is being made that any account will or is likely to achieve profit or losses similar to those shown.

Testimonials appearing on this website may not be representative of other clients or customers and is not a guarantee of future performance or success.

As a provider of technical analysis tools for charting platforms, we do not have access to the personal trading accounts or brokerage statements of our customers. As a result, we have no reason to believe our customers perform better or worse than traders as a whole based on any content or tool we provide.

This does not represent our full Disclaimer. Please read our full disclaimer.

bottom of page